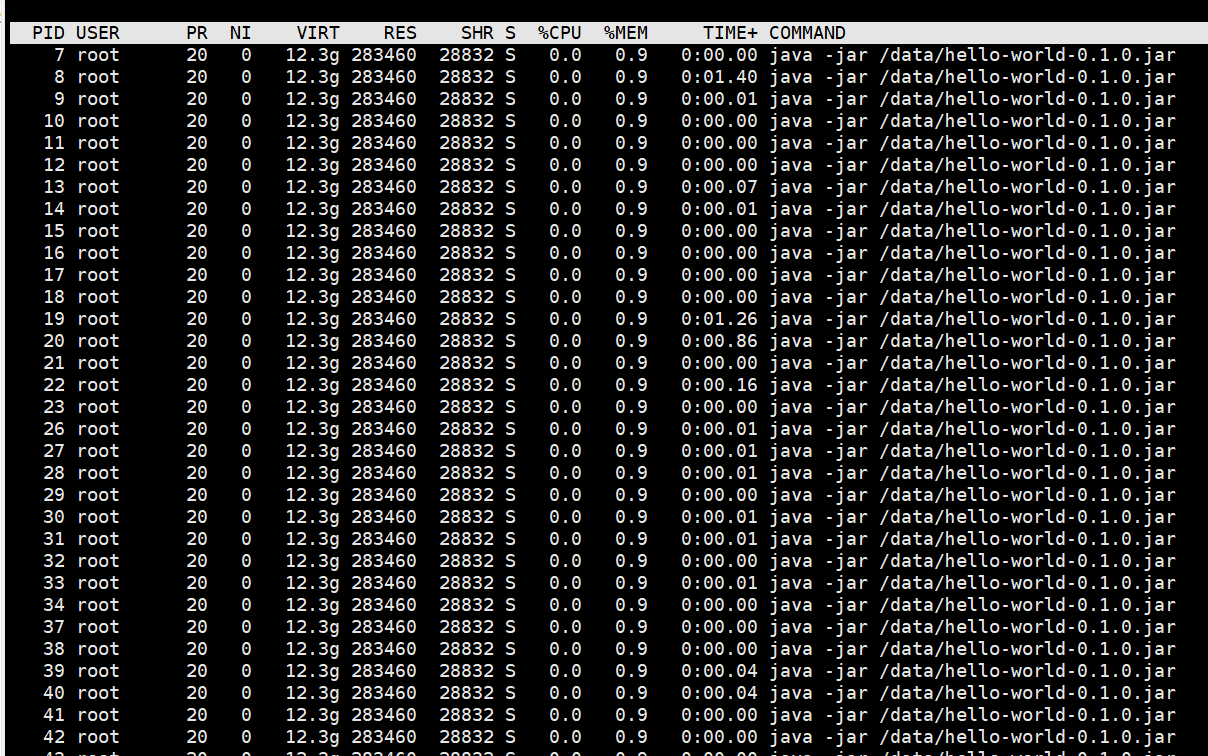
jps -l # find the right process ,if pid is 1
top -H -p 1 # find the top thread CPU usage in this process. different linux commond may different.
jstack 1 > stack.log # get current java thread info ,save to stack.log file
#if the CPU usage top 1 is 7
printf %x 7 # get the 16 hexadecimal value of thread id
#find the thread info from stack.log, can use vim or other commond to find.
grep "0x7" -A 10 stack.log
"http-nio-8080-exec-2" #20 daemon prio=5 os_prio=0 cpu=0.90ms elapsed=155.86s tid=0x00001465ecfb8800 nid=0x2b waiting on condition  [0x00001465ac2c4000]
   java.lang.Thread.State: TIMED_WAITING (sleeping)
	at java.lang.Thread.sleep([email protected]/Native Method)
	at com.dockerforjavadevelopers.hello.HelloController.index(HelloController.java:12)
	at jdk.internal.reflect.NativeMethodAccessorImpl.invoke0([email protected]/Native Method)
	at jdk.internal.reflect.NativeMethodAccessorImpl.invoke([email protected]/NativeMethodAccessorImpl.java:62)
	at jdk.internal.reflect.DelegatingMethodAccessorImpl.invoke([email protected]/DelegatingMethodAccessorImpl.java:43)
	at java.lang.reflect.Method.invoke([email protected]/Method.java:566)
    ....
	at org.apache.coyote.AbstractProtocol$ConnectionHandler.process(AbstractProtocol.java:889)
	at org.apache.tomcat.util.net.NioEndpoint$SocketProcessor.doRun(NioEndpoint.java:1743)
	at org.apache.tomcat.util.net.SocketProcessorBase.run(SocketProcessorBase.java:49)
	- locked <0x000000062aa88668> (a org.apache.tomcat.util.net.NioEndpoint$NioSocketWrapper)
	at org.apache.tomcat.util.threads.ThreadPoolExecutor.runWorker(ThreadPoolExecutor.java:1191)
	at org.apache.tomcat.util.threads.ThreadPoolExecutor$Worker.run(ThreadPoolExecutor.java:659)
	at org.apache.tomcat.util.threads.TaskThread$WrappingRunnable.run(TaskThread.java:61)
	at java.lang.Thread.run([email protected]/Thread.java:829)
# HELP executor_queued_tasks The approximate number of tasks that are queued for execution # TYPE executor_queued_tasks gauge executor_queued_tasks{name="applicationTaskExecutor",} 0.0 # HELP executor_pool_size_threads The current number of threads in the pool # TYPE executor_pool_size_threads gauge executor_pool_size_threads{name="applicationTaskExecutor",} 0.0 # HELP process_start_time_seconds Start time of the process since unix epoch. # TYPE process_start_time_seconds gauge process_start_time_seconds 1.676360742796E9 # HELP executor_queue_remaining_tasks The number of additional elements that this queue can ideally accept without blocking # TYPE executor_queue_remaining_tasks gauge executor_queue_remaining_tasks{name="applicationTaskExecutor",} 2.147483647E9 # HELP tomcat_sessions_rejected_sessions_total .....
这里不赘述 heap thread stack 知识。后续会有另外的文章介绍。
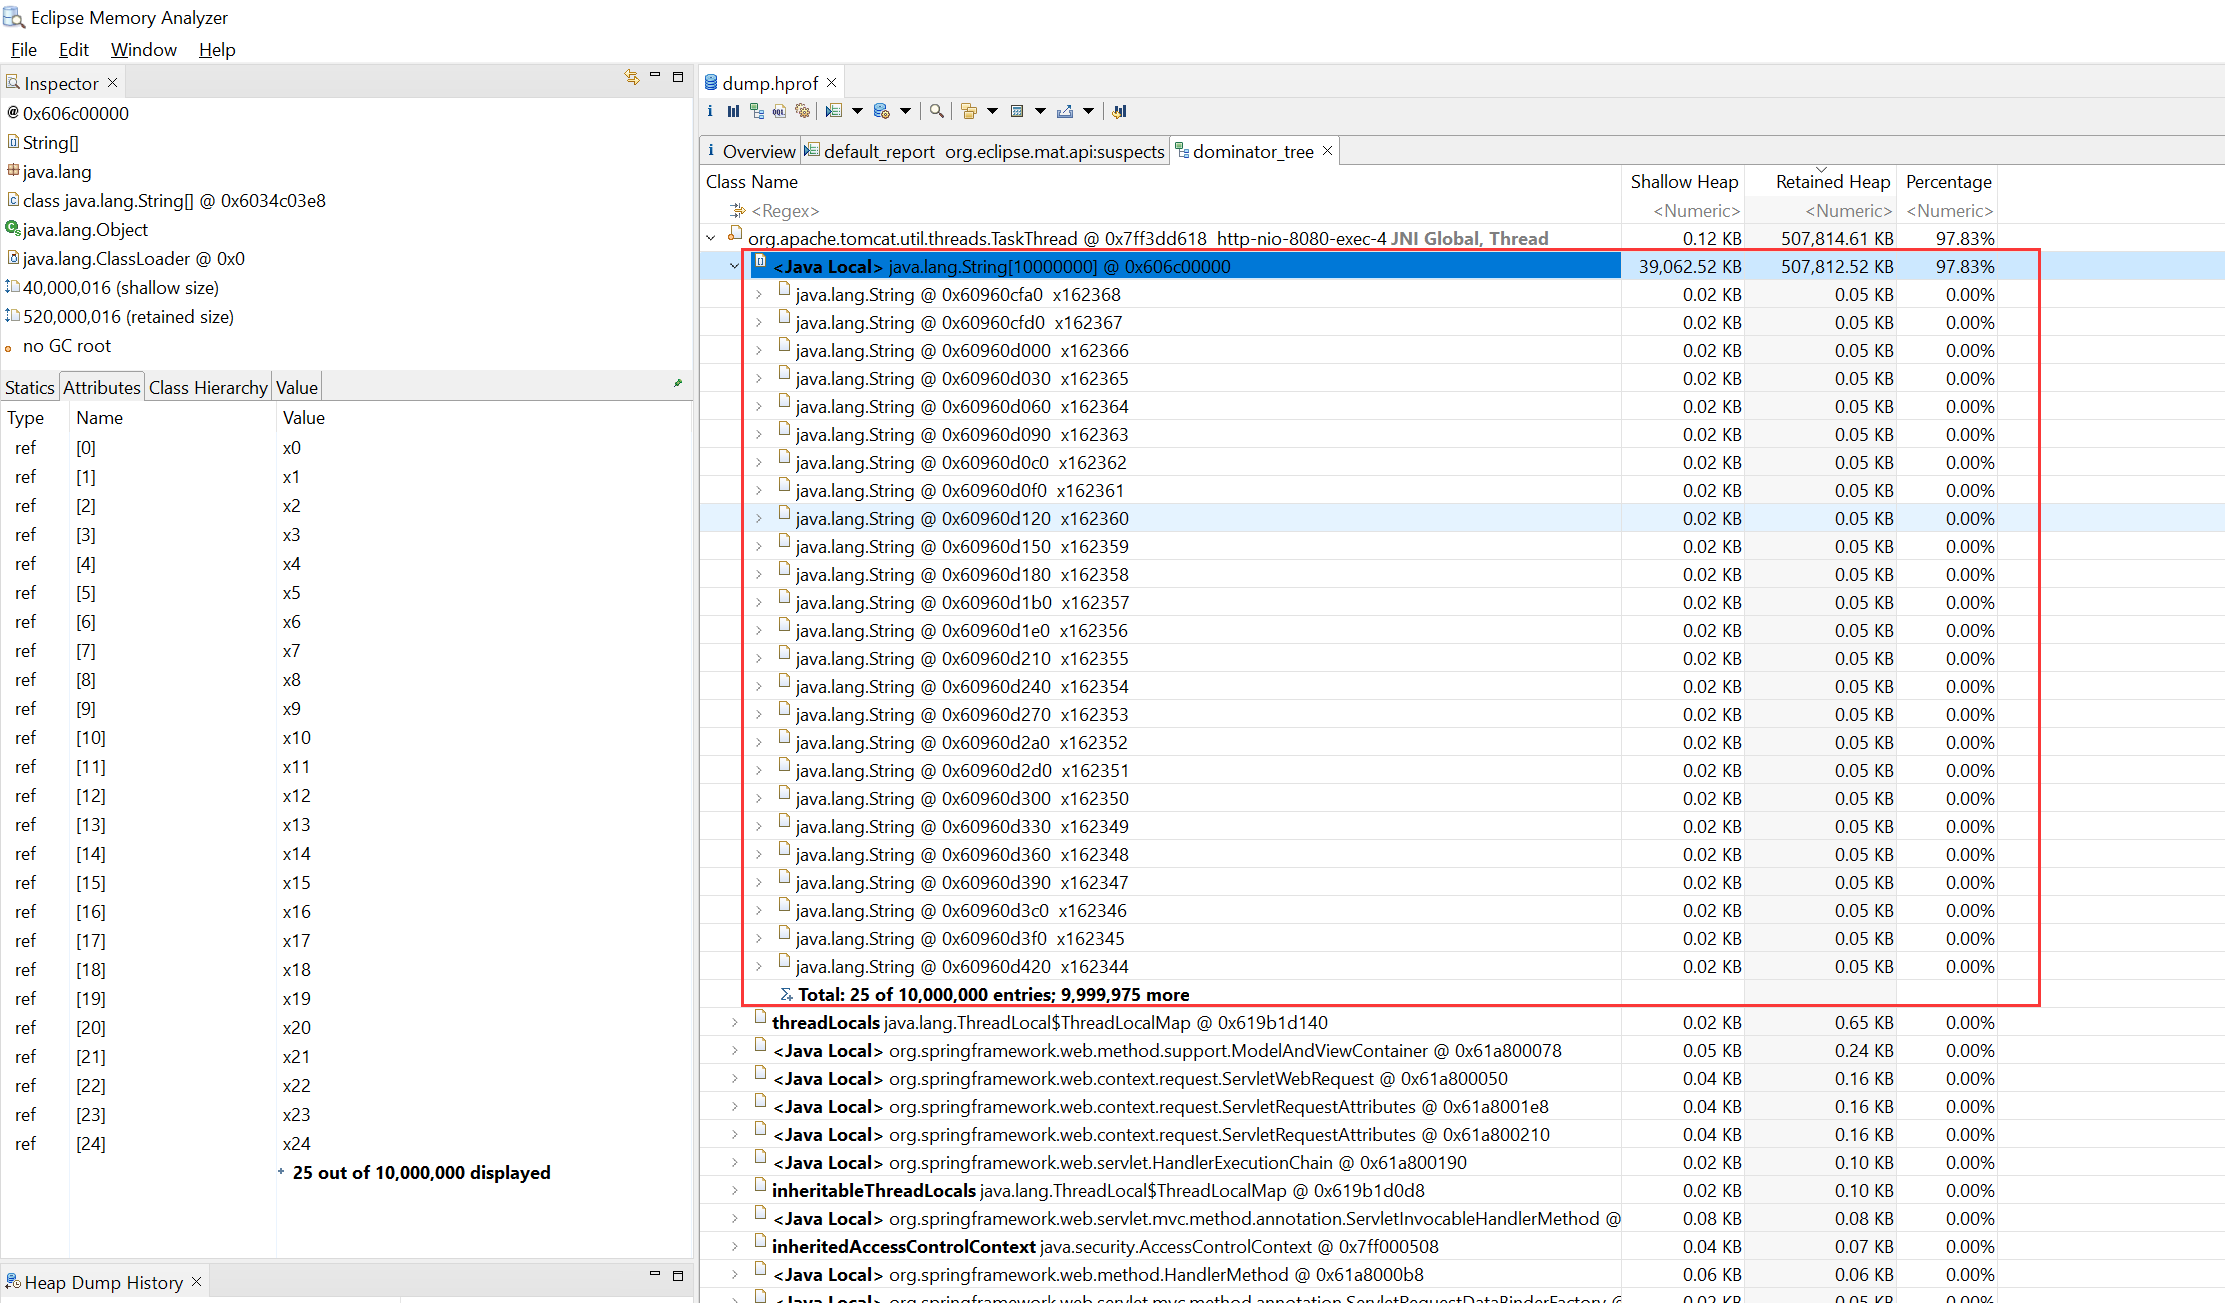
对存在 high memory 的服务进行 dump 分析 使用 jmap 对所有对象惑 live 对象进行分析(live 参数会强行让 jvm 做一次 full gc),详细使用可以参考jmap